
“Remember your history.”
Some of the best advice I’ve ever received as a Saints fan; though I hardly appreciated it when I first heard it following “Beastquake” and the subsequent heart-wrenching playoff loss (a feeling I’m all too familiar with now).
Whether coming off a blowout victory over our over-hyped division rivals (that’s what you get for trying to trademark “Tompa Bay“, honestly), or licking our wounds after a win streak skids to an awkward halt against a 3-8-1 team, remembering the long history of the New Orleans Saints serves as a balm for disappointment and puts our recent success in sharper relief. In the years since I first heard it, I’ve only come to more deeply appreciate this sound advice.
Though I was born into the Who Dat Nation as the grandson of longtime season-ticket holders, my fandom didn’t really start until 2010, when I moved to New Orleans to attend Loyola University. I’m sure I seemed a naive bandwagon fan following the franchise’s first Super Bowl victory, but I quickly found myself engulfed in the city’s love for the team and passion for analyzing and debating every minutia around the franchise.
During this time of learning the sport through the lens of my newfound fandom, I found myself asking what must have been to my friends an unrelenting storm surge of questions. Trying to dissect terminology, formations, strategy, timing, communication; the endless list of elements that make football simultaneously one of the purest team sport on earth and one of Herculean individual efforts played out over what commentators love to call, “a game of inches.” At the time, these questions nestled into my mind, but I didn’t have the tools or the understanding for how to find the answers.
Now, thanks to my experience in the realm of data analysis and the powerful tools provided by the team at nflfastr, diving into a data-driven discussion about football, and specifically my New Orleans Saints, has never been easier. Through this series of posts, I intend to do just that.
At the time of writing, the conclusion of the Payton-Brees era looms large over the horizon, with the flickering hope that the quarterback who helped revitalize the city will have his well-deserved chance to ride off into the sunset. What better time to remember our history.
The conversation starts by taking an exploratory dig into the Saints running attack over the last fifteen years.
Running Backs in the Payton-Brees Era
When someone brings up the New Orleans Saints offense, conversation naturally gravitates towards Drew Brees, the first-ballot hall-of-famer who is all but synonymous with the franchise. Even so, it is clear from the team’s off-the-field actions they understand the importance of the run game as a complement and catalyst for their dangerous, precise passing attack. Examples of this investment include selecting multiple running backs in the first round (Ingram, Bush), drafting offensive linemen specifically for the ability to block on the move (Armstead holds the 2nd fastest 40-yard dash time for an offensive linemen at the NFL combine), and continuing to develop blocking tight-ends like Josh Hill and rookie Adam Trautman. Throughout Payton’s tenure, the ground game has been an area of constant focus and effort.
In this initial exploration of the Payton-Brees era, we begin by evaluating the run game’s evolution through the lens of the running backs who have led the team over the last fifteen years.
Average Yards Per Carry and Career Rushing Attempts
As a starting point, we’ll take a simple look at the number of rushing attempts and average yards gained for players with more than 30 career rushing attempts with the Saints. Why 30? If a player only played with us for a single season, this is equivalent to an average of 2 rushing attempts per game. This felt like a good threshold for including non-running back players like Taysom Hill, who is certainly an important element to the modern Saints’ running scheme, while leaving off 4-week anomalies likes Adrian Peterson and his brief stint with the team.
Even just from this plot, we can observe a few interesting trends that begin to emerge. Perhaps most obviously, this graph demonstrates the longevity and consistency of Mark Ingram, who served as a constant presence in the Saints backfield for seven years. Averaging just over 4.5 YPC across such a tenure is no easy feat and is a testament to his endurance and consistency and overall effectiveness.
In addition, we can already glean a better understanding of why Payton loves deploying Taysom Hill so much. Though we still have a small sample size, Hill’s average YPC places him at a full yard higher on average than the staple running backs of years past and essentially presents him as a Darren Sproles who can also line up at QB and TE (and everything else). Note that this dataset ends in 2019, so it does not currently include Hill’s stint as a starting QB.
We can also see, though still with a smaller sample size, Latavius Murray’s effectiveness in comparison to similar secondary running backs who are more often deployed more exclusively the run game. Averaging closer to 4.5 YPC than Khiry Robinson, Tim Hightower, and even more prominently featured backs like Deuce McAllister and Reggie Bush, Murray has shown to be a solid addition to the team. As a tall, bruising runner, Murray can not only spell Alvin Kamara throughout a game, but can serve as a competent complement to the rest of the offense on his own merit as well.
As an aside, it is worth noting some of Murray’s success relative to backs from earlier in the Payton-Brees era is bolstered by an offensive line which has become one of the more stable and effective in the league in recent years. This topic will be explored in a subsequent exploratory analysis.
Finally, though this comes as no surprise, Alvin Kamara clearly presents himself as the most effective and efficient running back with more than 500 rushing attempts in his career as a Saint. This individual graph doesn’t even take into consideration his acumen as a receiver, which we will explore next.
Bruisers, (PT) Cruisers, and Kamara
It’s no secret that Brees and Payton both love utilizing running backs in the passing game. Whether setting up a screen or checking down, Brees frequently targets his running backs. But throughout this era, different running backs have been deployed in this way to a varying extent and to different degrees of success.
The plot below features running backs with more than thirty rushing attempts and thirty receptions in their Saints’ career. They are then compared by their effectiveness based on average yards per rushing attempt and reception, respectively. Finally, the color intensity reflects their volume of receptions while each point’s size depicts their rushing volume.

In this graph, we see a bit of natural clustering take shape. First, the more ‘pure’ running backs who often serve in secondary roles and primarily rush without as many opportunities for running routes. These backs include Hightower (whose receiving effectiveness is skewed due to low volume), Murray, Stecker, and McAllister (at least for the end of his career, captured here). Were it not for Ingram’s longevity with the Saints and his role evolving to include more passing opportunities, he would likely be added into this cluster as well.
The second cluster includes the running backs who served in a more hybrid role, including Ingram, Bush, Thomas, Sproles, and Kamara. Within this group, there’s still a broad spectrum of typical roles. On one extreme, Ingram was a workhorse running back who started catching passes more frequently later in his career, whereas Sproles always specialized in the passing game and occasionally served as a more traditional running back when necessary. If anything, this plot only further highlights the distinct role and value Ingram provided by being able to handle volume in both aspects of the game and provide value in both as well. Between these two extremes, you have Pierre Thomas, who was perhaps the definitive, if not a bit underrated, prototype running back of Payton’s offense who could run and catch in equal measure.
That was, of course, until New Orleans drafted Kamara, who has already established himself as perhaps the best running back to ever don the black and gold (is this a hot take? No.) Kamara has been, without hyperbole, nothing short of phenomenal and serves as the perfect complement to Drew Brees at the helm of the offense. Somehow, Kamara is simultaneously equally as effective as our best scatback as a receiver while also outperforming all running backs with similar volume as a rusher. Just how outrageous has Kamara been in his first few years in the league? We’ll take a look at this next.
Saints Running Backs YPC Per Year
From this graph, we can see each Saints running back with more than 100 carries in a given season and their average yards per carry in comparison to the NFL average, depicted by the black trend line.
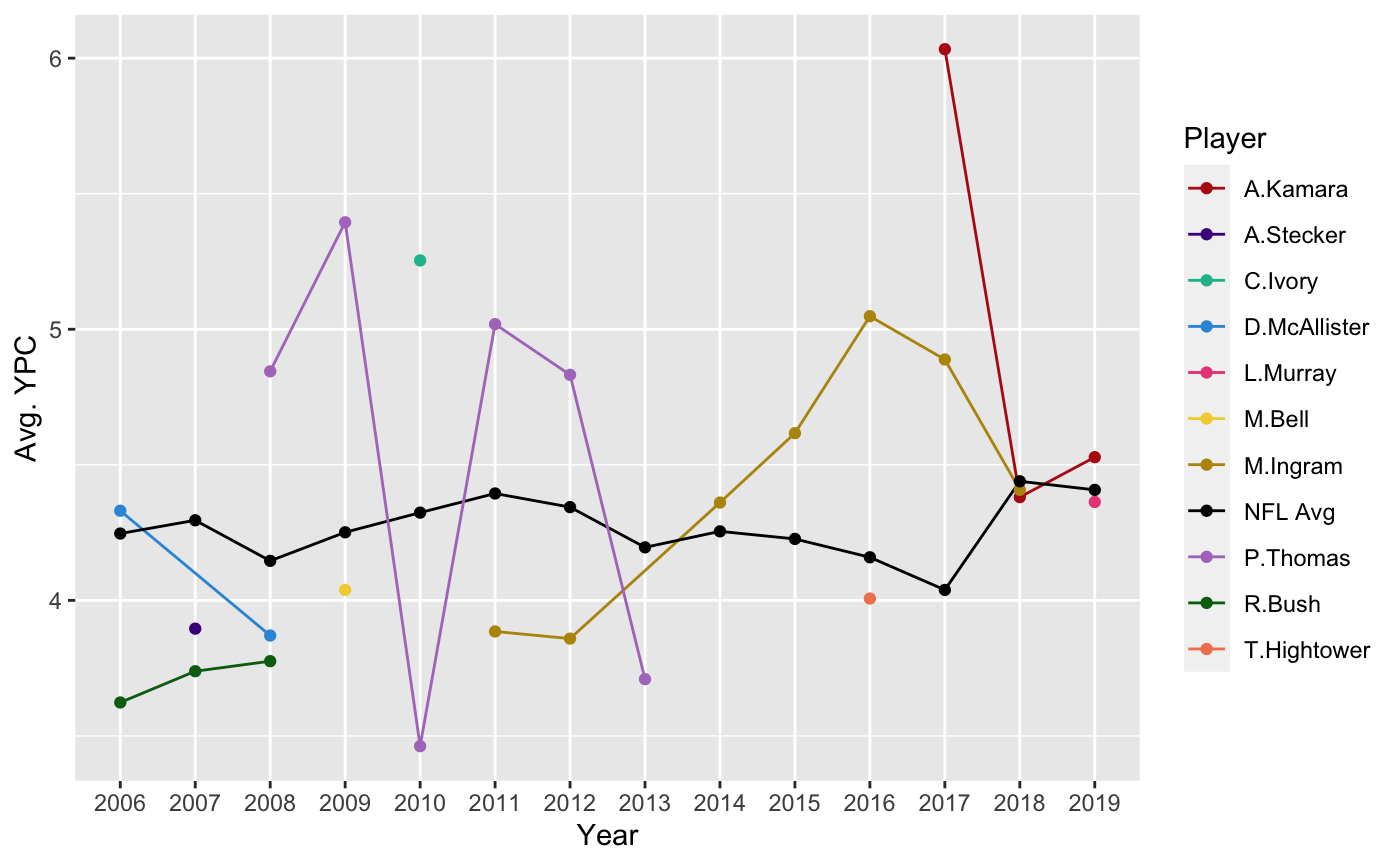
Jumping out from this visualization is Kamara’s unreal performance during his first season, during which he earned himself Offensive Rookie of the Year honors. While he ultimately regressed to closer to the NFL average in 2018 and 2019 (the latter of which he was dealing with minor injuries throughout), it is also worth noting the NFL average leapt up by a half yard as well.
Other aspects of the team’s history in the run game that are notable in this graph are the effectiveness of Pierre Thomas, especially given his volume shown in the previous figure, as well as another way of seeing Ingram’s value to the team. From entering the league in 2011, he became increasingly involved and effective in the run game, and this chart shows nothing for the intangible benefits of his presence in the locker room and as a veteran who had a year to mentor Kamara in 2017.
It also brings into sharper relief the relative ineffectiveness of Reggie Bush when compared to his NFL peers at the time as well as subsequent Saints’ running backs. This perhaps rings true with Saints fans who recall Bush as running more “east and west” than “north and south,” constantly trying to break a big run instead of taking a few yards and living to fight another day.
Finally, in a more comprehensive manner, it highlights the overall effectiveness of the more recent Saint’s rushing offense, especially in comparison to the NFL average. There are undoubtedly a number of elements which play into this - improved offensive line play, defenses prioritizing defending against the pass, and the overall increase in offensive output as a whole throughout the league.
Running Backs: EPA & Success Rate
While our previous post set a baseline of expectations by examining the Saints’ rushing attack through the lens of average YPC over time, we now take a closer look through two more advanced metrics provided to us by the nflfastr package: EPA (Expected Points Added) and Success Rate. We’ll begin with a broad view of these two metrics before breaking them down even further.
The authors of nflfastr note that EPA is a model predicting how many points the individual play is expected to add. Per their documentation, this particular instance takes into account the following elements:
Seconds remaining in half
Yard line
Whether possession team is at home
Roof type: retractable, dome, or outdoors
Down
Yards to go
Era
Timeouts remaining for each team
Success Rate, on the other hand, is percentage of plays that result in a positive EPA. So by comparing the two, we can see how often a player is expected to positively contribute toward their team scoring versus the rate at which they actually do.
Average EPA
Let’s first look at the Mean Expected Points Added for each Saints running back with more than 100 attempts per season compared to the NFL average. Especially when contrasted against the YPC conversation, this visualization highlights the overall effectiveness of the New Orleans run game as well as the volatility between players and seasons.

First, Kamara’s myriad of injuries in 2019 are further depicted with his third year in the league seeing his season average EPA dropping below the NFL Average while running mate Murray performed above this threshold. Writing this only days after Kamar’s historic Christmas game in which he scored six (six!) rushing touchdowns, I look forward to comparing these results to a complete 2020 season and how his trend changes with another healthy season on his resume.
Similarly, the graphic highlights the importance of Pierre Thomas as a crucial component of the Saints’ first Super Bowl season in 2009 as well as the ridiculously potent offense of 2011. Contrastingly, we continue to see the relative ineffectiveness of Reggie Bush when it comes to how frequently his players were expected to add points to a particular drive.
Success Rate
Using the same plotting and color scheme, we can better understand the nuance between EPA and Success Rate. Whereas the first is a model’s estimation of the player’s contributions, Success Rate evaluates the play itself and whether it resulted in a positive EPA. In doing so, a few additional noteworthy trends surface.

For the first time, we see an area in which Reggie Bush exceeded the NFL average. So while he was expected to add points less than his NFL peers, he succeeded in providing a positive outcome at a higher rate during the 2007 season. Even so, Payton quickly found a better alternative in Pierre Thomas in 2008, who would go on to exceed a .50 Success Rate in 2011. In fact, all three running backs with more than 100 carries that year performed well above the NFL average, including Ingram during his rookie season.
While the following years saw the team regress closer to the mean, it is equally impressive that Ingram maintained an above average Success Rate even during the dreaded 7-9 seasons. Thankfully in 2017, the losing season trend flipped with the dominant draft class featuring Alvin Kamara among many other notable Saints stars. While not leaping off the graph in the same way his average YPC metric did, Alvin’s success rate still depicts an impressive rookie campaign and a trending performance marred by injury. Impressively, even an injured Kamara outperformed his NFL peers over the course of the season.
Finally, it’s interesting to note Murray’s below-average Success Rate in comparison to his above-average Mean EPA. This could perhaps be explained in that Murray was more often deployed in obvious run situations where a defense could reasonably scheme to stop him, so while his EPA, which does not take the defense into account, was higher, his Success Rate did not reach the same level. It’ll be telling to compare his second season in the Saints offense once the regular season concludes next week.
This comparison raisess the question - who most outperformed their EPA and turned the opportunities into actual success? We plot both metrics for a glimpse into predictions and productivity below.
EPA and Success
Putting these two figures together and aggregating each player’s years with the Saints, clear trends begin to form as to clusters of players who outperformed their EPA and drove the success of the team’s rushing attack throughout their careers.

As was to be expected from the two previous visualizations, Pierre Thomas outperforms all of the other running backs in his career average for both EPA and Success Rate. Similarly, we observe Alvin Kamara quickly rising to the top only three years into his career. This particular depiction also highlights the effectiveness of McAllister who had a more modest appearing YPC average as well as the collective effectiveness of backup running backs in Ivory, Murray, and Hightower who all exceed the NFL Average in at least one, if not both EPA and Success Rate while in New Orleans.
Perhaps a bit surprisingly, Ingram maintains a slightly negative Career EPA for his tenure with the Saints. How can a player who was so productive in terms of YPC have a negative EPA? Well, as ESPN explains, “EPA knows that not all yards are created equal.” In a hypothetical situation they describe, an 8 yard carry on 3rd and 10 results in a negative EPA, whereas the same 8 yards on 3rd and 7 having a highly positive EPA. So while Ingram had an effective career, due to playing during a stretch of losing season for the Saints, it’s likely that his effectiveness was mitigated by the situations he found himself in during those years.
Beyond the comparative performances denoted above, the trends of which players over- and under- performed relative to one another highlights to me the importance of the context. Which portion of the Payton-Brees era each running back contributed to clearly underpins an understanding of their contributions as well as the benefits they received from surrounding cast members.
While Drew Brees has been a near constant throughout the last fifteen years, the offensive line in particular has seen several major shifts across the time.
The Offensive Line: PFF Grades & Context
With so many different positions and individual players to consider along the O-line, we’ll start by setting the scope of our evaluation.
First, we’ll be considering the primary player for each position from a given season, as listed by ProFootballReference. These are the five offensive lineman with the most snaps across the season, so we won’t be taking into account lineman who played in relief when starters were injured or how players splitting at different position affected play. Second, we’ll be evaluating offensive linemen by their ProFootballFocus grades and the free-access stats they provide - snaps played, penalties, and sacks allowed.
We’ll start by looking at the PFF Grades by position for the Payton-Brees era. As a note, the graphic is divided into four distinct “sub-eras” of the last fifteen years and we’ll get more into what those mean in the next update.
Offensive Line PFF Grades by Position

Even before subsetting the positions by individual player, a few key trends emerge worth noting when looking at offensive line quality holistically.
First, is the obvious outlier of Andrus Peat. Since 2006, no Saints offensive lineman has been graded below a 60, except for Peat, who has fallen below 50 twice. And it was after these two seasons the Saints front office extended his contract with a five year, $75 million contract. We’ll address this further below.
Second, we can see the broad trend of how the highest caliber play has shifted from the guards to the tackles over time. In recent history, the offensive line has been led by a pair of fantastic tackle draft picks, but this was not always the case. For much of the Payton-Brees era, the O-Line was led by elite guards who were capable of allowing Drew Brees (who, if you didn’t know, is only barely 6’0’’, a diminutive size for quarterbacks, as every announcer loves to discuss) to have clear throwing lanes and to step up into the pocket without issue.
| Name | Sack Rate | Penalty Rate |
|---|---|---|
| Andrus Peat | 0.43 | 0.55 |
| Ben Grubbs | 0.21 | 0.27 |
| Brian De La Puente | 0.22 | 0.28 |
| Carl Nicks | 0.21 | 0.31 |
| Charles Brown | 0.74 | 1.26 |
| Erik McCoy | 0.09 | 0.76 |
| Jahri Evans | 0.24 | 0.52 |
| Jamar Nesbit | 0.09 | 0.32 |
| Jammal Brown | 0.28 | 0.98 |
| Jeff Faine | 0 | 0.25 |
| Jermon Bushrod | 0.42 | 0.59 |
| Jon Stinchcomb | 0.36 | 0.49 |
| Jonathan Goodwin | 0.16 | 0.24 |
| Larry Warford | 0.14 | 0.43 |
| Max Unger | 0.19 | 0.07 |
| Ryan Ramczyk | 0.26 | 0.49 |
| Terron Armstead | 0.31 | 0.47 |
| Tim Lelito | 0.11 | 0.21 |
| Zach Strief | 0.38 | 0.5 |
In the table above, we can also quickly compare the players in terms of the rate at which they allowed sacks or accrued penalties (most typically, False Start or Holding). I will admit, for how often it feels like I have heard referees call out Peat, the fact that he is flagged on less than 1% of his snaps puts my evaluation of him in context. Equally, I’m not particularly surprised to see McCoy, who only has his one rookie season in this dataset, with a higher than average rate, one I assume will regress to the mean with time and experience.
As for the Sack Rate, it’s no surprise to see Peat near the top of the list, as this likely explains a portion of his dreadful grading. Armstead and Strief both appearing in the top third does come as a bit of a surprise, though this may be somewhat attributed to the role of tackles facing off against increasingly dangerous edge rushers. In fact, besides Peat, almost the entire first half of the list are tackles, followed them by mostly guards, and then mostly centers. So, though there is clear degrees of quality of play, these trends may also be the result of the nature of the game more than individual performances over the last fifteen years.
With this broad view established, let’s take a closer look at each position group.
Left Guard PFF Grade By Player per Season

Primarily, the guard positions were held down by Carl Nicks and Jahri Evans, both of whom shared the field from 2008 to 2011, though Evans would hold down the right side of the field starting back in 2006 and pair up with Ben Grubbs, (perhaps an underrated Left Guard with the difficult task of following up Nicks) until 2016. We can see from here the effectiveness of Nicks as well as Grubb’s above-average performance, especially in light of Peat’s recent struggles. While his grade has improved so far in 2020 (58.2 with one regular season game left to play), it would still be the lowest PFF grade since 2006 for any offensive linemen except for Peat. Comparatively, PFF ranked Peat’s 2019 effort as “79th out of 90 qualifiers.”
Right Guard PFF Grade By Player per Season

Flipping to the right guards, we can see not only the early elite years of Carl Nicks, but also his decline into good-not-great, and eventually average play as his career continued. Larry Warford stepped in and managed to maintain similar play with a boost in 2019. Not pictured, 2020 saw the pair of rookie Caesar Ruiz and Nick Easton sharing snaps at the Right Guard position, one that would be highlighted as a point of possible exploitation by defensive lines throughout the season.
Left Tackle PFF Grade By Player Per Season

With the drafting of Left Tackle Terron Armstead in 2014, however, the Saints franchise shifted towards a team more balanced across the offensive line. In context of his predecessors at the position, it becomes clear that even Armstead’s lows have been equivalent to the highs of previous players, with his highs placing him in elite company. Since 2017, Armstead has ranked 6th among all Offensive Tackles and his pass-block grade ranks second during the same three-season span.
Right Tackle PFF Grade By Player Per Season

By 2017, the addition of Ryan Ramczyk led the Saints to claiming one of the most dominant pairs of Offensive Tackles in the league. That is not to overlook Stinchcomb or Strief, both of whom protected Drew Brees for a number of years and posted comparable PFF grades throughout their tenure. Even so, it’s hard not to see the ascending performance of Ramcyzk and appreciate how much his play has elevated the Saints’ offense. In fact, since 2017, Ramczyk has ranked second among all qualified tackles in PFF grade. As they discuss in their pre-season offensive line rankings, his grade for the first three years is only bested by two other tackles since 2006 - Joe Thomas and Jake Long. He also has a 90.2 run-blocking grade, which places him second since 2017 in that specific aspect as well.
Center PFF Grade by Player Per Season

And finally, the Center position. The middle of the line has been a relatively stable, if not exceedingly notable position. And that perhaps, is a great complement to a position that its often good news to not hear mentioned during broadcasts. The early portions of the era saw Jeff Faine, Jonathan Goodwin, and Brian De La Puente hiking the ball and warding off nose tackles until 2015. Following the surprise trade of Jimmy Graham to the Seahawks, Max Unger took over the Center position with two average graded years followed by a pair of sub-par years. Following his unexpected retirement, the Saints drafted Erik McCoy, who went on to have an impressive rookie campaign.
Side note: I met Max Unger in a pizza shop after a Saints away game. He told the hostess he was “picking up dinner on his way home from work.” She mistook him for a Pelicans player. He was very nice and shook hands with all of us and signed someone’s hat. Damn me for not wearing hats.
With this context for how the construction of the offensive line has shifted, the comparable success of individual players at each position, and the overall ebb and flow of the offensive line as a whole all in mind, we can more fully consider the relative success of the running backs we’ve evaluated previously.
No single running back found themselves supported by a cast of entirely dominant offensive lineman. Pierre Thomas seems to have benefited the most from the pair of elite guards the Saints featured during the Super Bowl run leading up to the 09-10 season. Similarly, Kamara has been the most prominent beneficiary of arguably the best pair of tackles to ever play in black and gold in Armstead and Ramczyk. Finally, these observations perhaps highlight the impressive performance of Deuce McAllister, largely considered one of the all-time greats, for his performance amidst a mostly average offensive line.
Conclusion
Despite data tools like nflfastr making this analysis more accessible than ever, the reality remains that the measuring the individual performance and efficiency of players remains a complicated and nebulous undertaking. Each metric used throughout the exploratory data analysis endeavor is a custom, opinionated, and inherently biased result of trying to contribute to individuals some portion of a collectively determined outcome. Even so, the exercise itself continues to hold merit. Through this analysis, we come to appreciate the absurd, pure athleticism of players as their feats can be seen on the field and quantified in some way through these data visualizations. We discover newfound appreciation for players who performed better than the ‘eye test’ might have initially implied. We celebrate reaching the pinnacles of success and learn from walking through valleys of defeat.
But most importantly, we remember our history.